

In web development, Django stands as a towering beacon of hope for developers seeking to craft elegant, high-functioning web applications without getting entangled in the web of complexity that often accompanies such endeavors.
However, even in this refined landscape, bugs, like uninvited guests, find their way into the code, disrupting the serene flow of zeros and ones. Fear not, for the art of debugging in Django is akin to a thrilling detective story, where each bug is a mystery waiting to be solved, and you, the developer, are the detective with a bunch of tools at your disposal 🔨
Imagine yourself stepping into the shoes of a digital Sherlock Holmes, where your first clue often lies in the logs. Django equips you with a built-in logging system, a versatile toolkit allowing you to configure the LOGGING dictionary in your settings.py file to capture and record various levels of information. This system comprises:
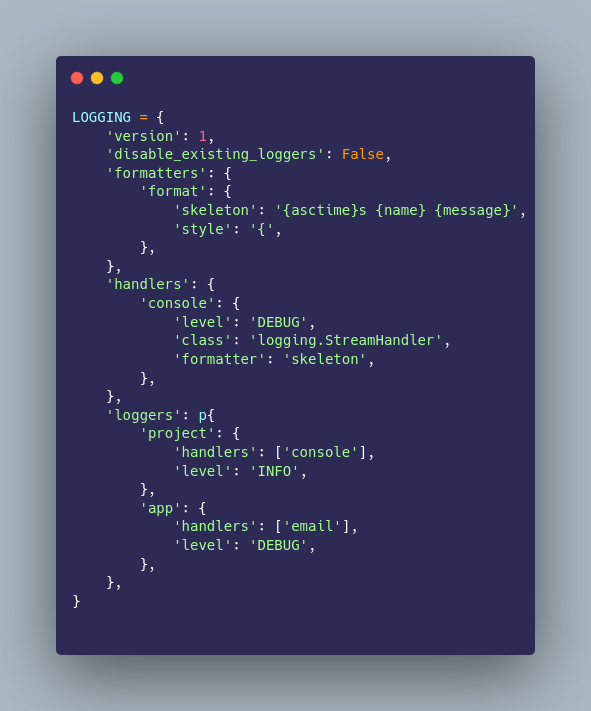
Django’s logging system adheres to Python’s severity levels, from the casual inquiry of DEBUG to the urgent alert of CRITICAL. Like a spy agency’s alert system, each level signals the severity of the situation, guiding the detective on when to spring into action.
Python has six log levels with each one assigned a specific integer indicating the severity of the log:
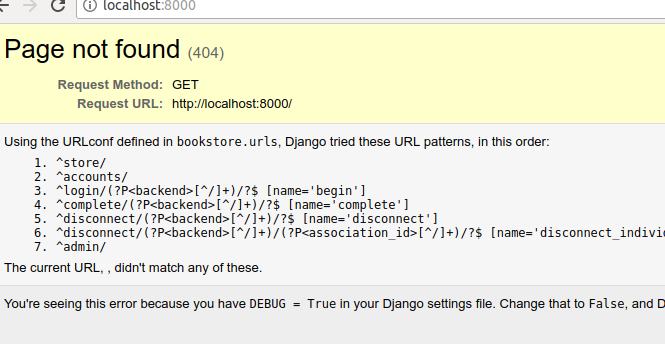
With DEBUG=True, Django unveils detailed error pages, offering a first glance at the crime scene. These pages, rich with tracebacks and request information, are your initial clues.
NOTE: In server environments, keep this flag as False.
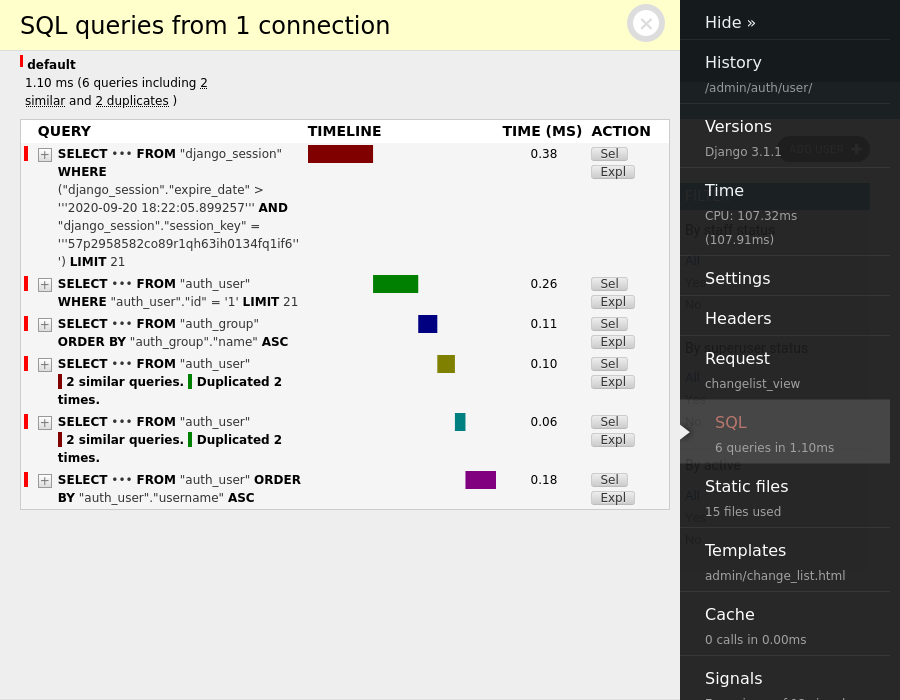
The Django Debug Toolbar is akin to a detective’s Swiss Army knife, a versatile gadget that, once installed and configured, arms you with insights into queries, cache, signals, and more. Installation is straightforward, enhancing your debugging arsenal with minimal fuss.
1. Install: Install the Django Debug Toolbar using pip.
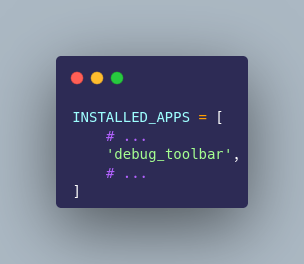
2. Add 'debug_toolbar' to your Django project’s INSTALLED_APPS in the settings.py file
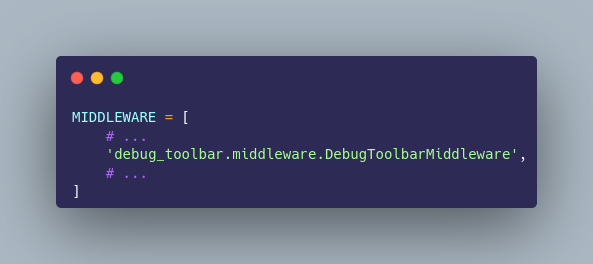
3. Add 'debug_toolbar.middleware.DebugToolbarMiddleware' to your MIDDLEWARE in the settings.py file
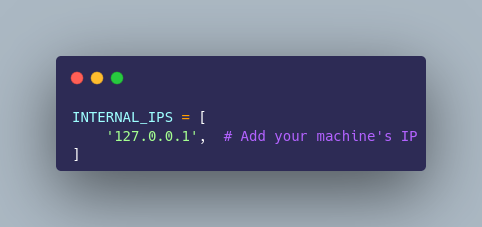
4. Configure the INTERNAL_IPS setting to include your development machine’s IP address in the settings.py file
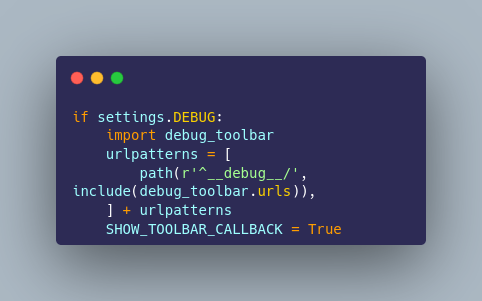
5. You need to manually add djdt routes to the end of urls.py file
6. Click on the panels in the toolbar to access various debugging information. Some common panels include:
PDB/IPDB: The Interrogation Room: Venturing deeper into the investigation, tools like pdb or ipdb serve as your interrogation room, where you can pause the execution of your application to interrogate your code. Setting breakpoints and stepping through the execution allows you to inspect variables and the flow of execution with precision.
1. Import: First, you need to import the pdb module at the beginning of your Python script or view function where you want to start debugging.
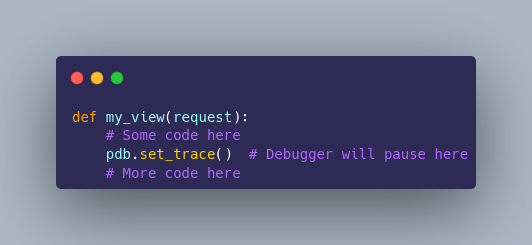
2. Set a Break-point: Place the pdb.set_trace() function at the point in your code where you want to start debugging. This serves as a break-point where the debugger will pause execution and give you control.
1. Install: If you haven’t already installed ipdb, you can do so using pip
2. Import: In your Django view or Python script, import ipdb
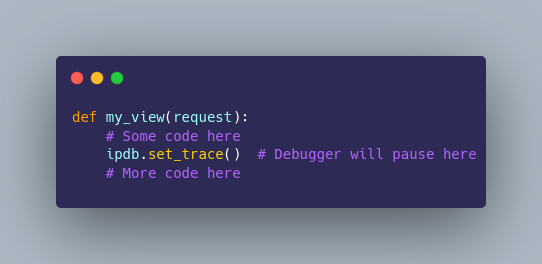
3. Set a Break-point: Place the ipdb.set_trace() function at the point in your code where you want to start debugging. This serves as a break-point where the debugger will pause execution and give you control.
4. Interact: Once the debugger is active, you can use various commands to inspect and control the execution flow.
Commands:-
n or next: Continue to the next line of code.s or step: Step into a function or method.c or continue: Continue execution until the next break-point.q or quit: Quit the debugger and terminate the application.p variable: Print the value of a variable.h or help: Display help for debugger commands.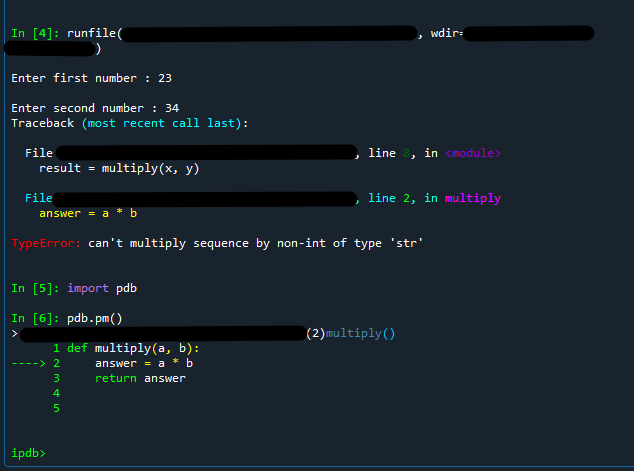
Django-Silk acts as a behind-the-scenes investigator, silently monitoring and recording your application’s performance. By profiling requests and queries, Silk uncovers the inefficiencies and bottlenecks that lurk in the shadows, presenting its findings in a user-friendly UI.
1. Install: Install the Django Silk using pip.
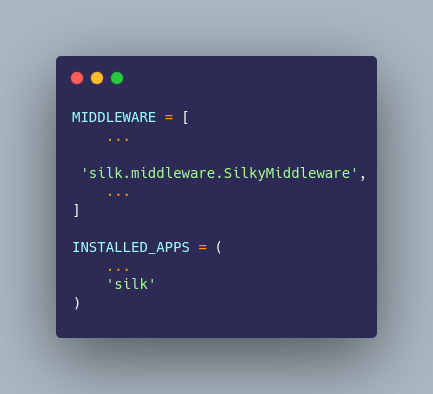
2. In settings.py add the following:
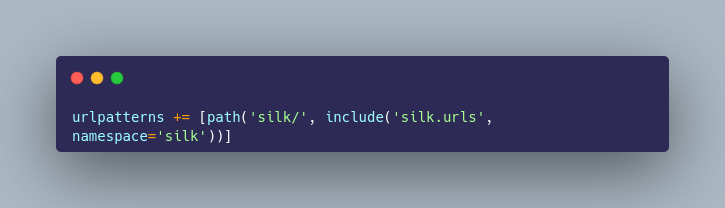
3. To enable access to the user interface add the following to your urls.py:
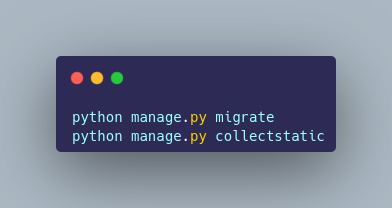
4. Before running the project run:
Silk will automatically begin interception of requests and you can proceed to add profiling if required. The UI can be reached at /silk/
NOTE: Use Django-silk in Local environments only, as it will slow down the server environment.
When the case takes a complex turn, tools like Sentry and Rollbar come to the rescue. These platforms specialize in capturing and tracking errors in your application, especially in production environments. They act as the backup team where expertise from outside can provide the crucial insights needed to crack the most perplexing cases.
Setting them up is similar to calling in the specialists; with just a few configurations, they’re on the case, monitoring your application for any signs of trouble and alerting you the moment something goes awry. This peace of mind allows you to focus on development, knowing that your application is under the vigilant watch of the best in the business.
Imagine Sentry as the lookout in your debugging team. With its keen eye on your Django application, Sentry alerts you to issues before they escalate into full-blown crises. It tracks errors in real-time, offering detailed insights into what went wrong and where, facilitating a swift resolution. Setting up Sentry involves integrating its SDK with your Django project, a small step for a developer but a giant leap in your battle against bugs.
Rollbar plays the strategist’s role in your debugging arsenal. It not only captures errors as they occur but also analyzes and categorizes them, helping you prioritize which issues to tackle first based on their impact. Integration with Django is straightforward, ensuring that no error goes unnoticed and that you have all the data you need to make informed decisions about fixes and improvements.
In the evolving landscape of web development, AI tools stand out as beacons of innovation, offering unprecedented support to developers. These tools not only expedite the debugging process but also enhance code quality and developer productivity. Below is a table of the latest AI tools that Django developers can leverage.
| AI Tool | Description | How It Benefits Django Developers |
| CodeGPT by OpenAI | A cutting-edge AI model trained to understand and generate code based on natural language descriptions. | Automates code generation, making development faster and easier. |
| BugSpot | An AI-powered tool that predicts potential bugs in your code based on historical data. | Helps prevent bugs before they occur, saving time on debugging. |
| AI Code Reviewer | Uses machine learning to review code and suggest improvements for efficiency and adherence to best practices. | Enhances code quality and ensures best practices are followed. |
| DeepCode by Snyk | Scans code for vulnerabilities and provides suggestions for automatic fixes. | Improves security and reduces the risk of vulnerabilities. |
| TensorFlow for Developers | An open-source machine learning framework that can be used to build intelligent features into Django apps. | Enables the integration of machine learning models into apps. |
In conclusion, while the allure of AI tools in enhancing the Django development process is undeniable, it’s crucial to recognize that these innovations are but a part of a much larger ecosystem. The journey through the landscape of web development with Django is marked by the meticulous crafting of elegant solutions, the thrill of debugging akin to unraveling a complex mystery, and the strategic deployment of advanced tools and techniques. From the foundational practices of logging and error handling to the sophisticated use of AI for code optimization and bug prediction, each element plays a pivotal role in shaping the robust, efficient, and secure web applications that define our digital era.
The essence of this journey is not solely in the adoption of new technologies but in the harmonious integration of traditional and cutting-edge methodologies. It’s about leveraging the strength of Django’s framework in tandem with AI’s potential to elevate the craft of web development to unprecedented heights. By embracing this holistic approach, developers are equipped to navigate the challenges of the present and future landscapes, driving innovation, enhancing productivity, and ultimately delivering web applications that stand as testaments to their skill and the dynamic capabilities of Django.
As we look forward, it’s clear that the evolution of web development is a continuous journey, one that demands a commitment to learning, adaptation, and the integration of diverse tools and practices. The future of Django development, enriched by AI and underpinned by the robustness of traditional debugging and development techniques, holds the promise of more sophisticated, user-centric, and impactful web applications. This journey, though challenging, is replete with opportunities for developers to redefine the boundaries of what is possible, making it an exciting time to be at the forefront of web development.